Other

Caroline
How to create impactful data visualizations?

In a world overflowing with data, people consider data visualization essential for transforming complex information into clear and impactful visual stories. By harnessing the power of visual processing, it facilitates instant data comprehension.
However, users must adopt a thoughtful approach to avoid the pitfalls of deception and ensure transparent, effective communication. This article explores the importance of data visualization and offers tips for creating impactful and accurate visualizations.
In the complex world of data, data visualization plays an essential role. It helps us navigate in an ocean of information and produce impactful data visualizations. Visualizations transform raw data into compelling visual stories and they can also influence or bias perception.
In fact, visual processing takes up more than 50% of the human brain, making visualizations the most effective way to understand and interpret complex information instantly.
As data scientists, we play a central role in data visualization. It allows us to explore data by highlighting key elements and presenting results in an impactful way.
This article will explore the crucial importance of data visualization and the pitfalls to avoid through striking examples.

The climate "stripes" have have had a significant impact and influence since their launch in 2018 by Professor Ed Hawkins. These colored vertical bands convey a powerful message without the need for words, numbers or charts. Each stripe represents the average temperature of a year compared to the average over the entire period. Shades of blue indicate years cooler than normal, while red highlights warmer years. The marked alignment of bright red stripes on the right side of the image reveals the rapid warming of our planet over recent decades.
This visualization gained traction quickly, with over a million downloads in the week following its 2019 launch. The climate "stripes" have become a universal symbol, adopted by weather presenters, scientists, and activists, and displayed on stage at festivals or on electric vehicles.
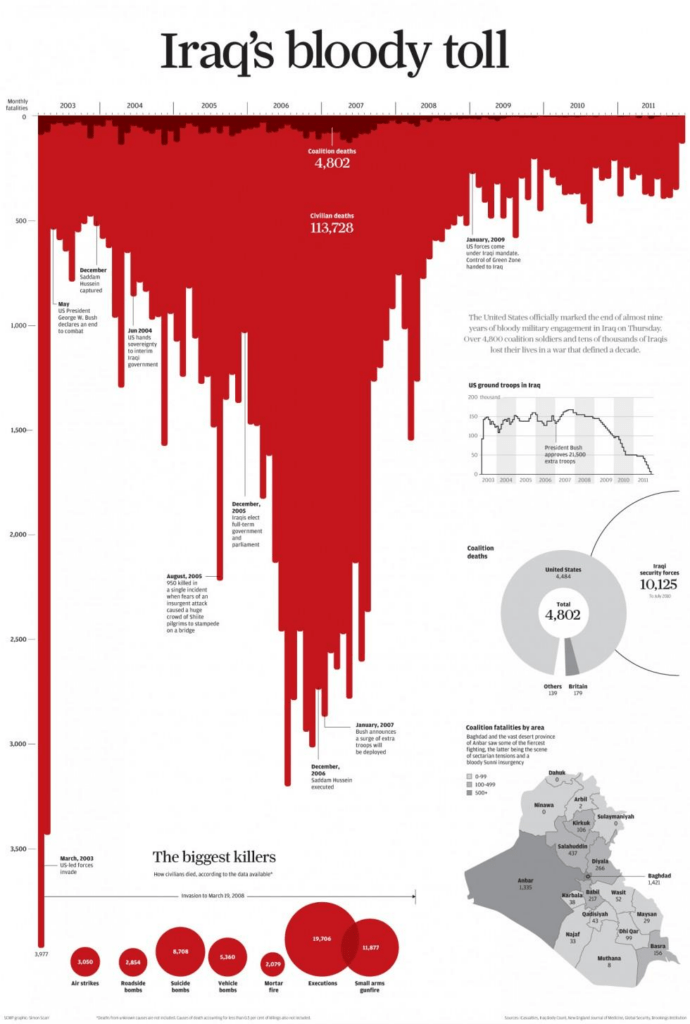
This visualization highlights the number of civilian and military deaths in Iraq during the American presence. This powerful and unsettling inverted bar chart creates the impression of a bloodstain. Beyond its striking visual significance, this graphic representation evokes the scale of the tragedy that affected Iraq during this period. It transcends mere numbers to remind us of the human impact of conflicts and wars, focusing on suffering and the loss of life.
Other dimensions, such as region, cause of death, and key dates, are also presented to provide context to the main chart.

This visualization compares Leonardo DiCaprio's age over time with that of his partners, revealing an intriguing narrative. As expected, DiCaprio's age follows a straight line. In contrast, his partners' ages follow a generally constant pattern, showing a tendency to remain within a narrow range, between 18 and 25 years old.
This representation, easily understood at a glance, raises questions about social norms, celebrity, and personal relationships, while highlighting how visual data can tell intriguing, and sometimes unexpected, stories.

This visualization shows how the price of Bitcoin has fallen over the last 13 years. By using a visually striking drop effect , it reinforces the idea the reader might already have that Bitcoin is a very poor investment.

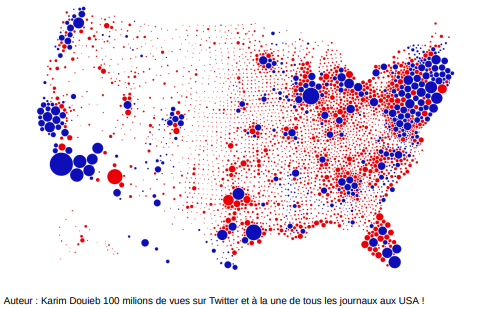
Donald Trump released the first visualization during the 2019 presidential election. It features a map of the United States, colored primarily in red, suggesting a landslide victory for the Republican Party. This visualization was widely circulated, becoming a key communication tool and even being printed on a variety of promotional products, which speaks to its significant impact.
However, a second visualization presents the same data in a different way and suggests that blue is more widespread.
In reality, the first visualization shows the counties that voted for the Republicans and those that voted for the Democrats. The second presents the same information, but with the counties represented by circles whose size is proportional to the voting population in those counties.
This case illustrates how visually representing data can influence the understanding of election results and highlights the importance of transparency and objectivity in data visualization, particularly in a political context.
"Land doesn't vote, people do!"



The three visualizations present the same figure, which represents an infant mortality rate of 4.3%. In the first visualization, this figure creates an impression of severity because it is isolated. In the second visualization, it is compared to the infant mortality rate in the European Union, which is lower at 0.45%. This comparison offers a slightly more optimistic perspective, although a difference remains, suggesting that the situation could be improved. In the third visualization, the figure is compared to the past infant mortality rate, which was approximately 50%.
This comparison highlights a very positive trend given that the current figure is significantly lower. These different representations of the same figure demonstrate how framing information can considerably influence interpretation and conclusions, thus underscoring the importance of critical data analysis in visualization.

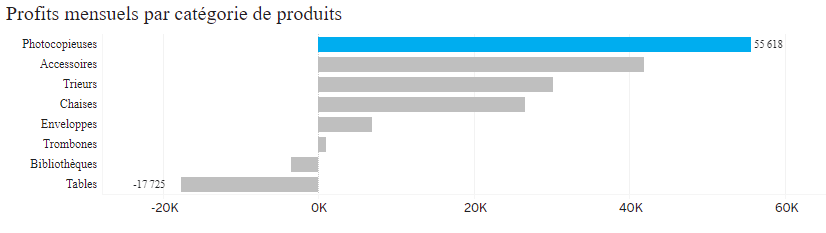
In these two bar charts, the difference in color creates a striking contrast in how information is presented. In the first chart, where each bar is a different color, it is difficult to distinguish a key message. The variety of colors can be distracting and does not contribute to the delivery of information. In contrast, in the second chart, the use of gray for most of the bars highlights the uniqueness of the colored bar, clearly indicating where the important message is. This simplified approach to visualization helps the viewer quickly interpret essential data. It allows for the creation of impactful data visualizations.
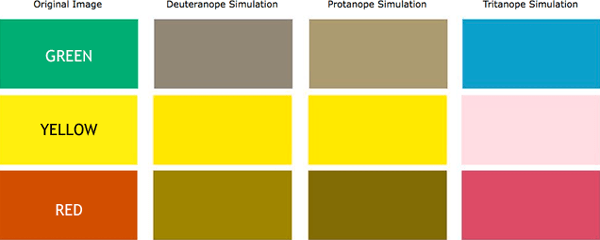


Color perception varies significantly from person to person. Approximately 8% of men and 0.5% of women are affected by color blindness, a condition that prevents them from distinguishing colors correctly. The most common form is red-green color blindness, colors that are often used in visualizations. Furthermore, various studies show that cultural and gender factors can influence color perception. Understanding these differences is essential when designing data visualizations to ensure they are accessible to a diverse audience.
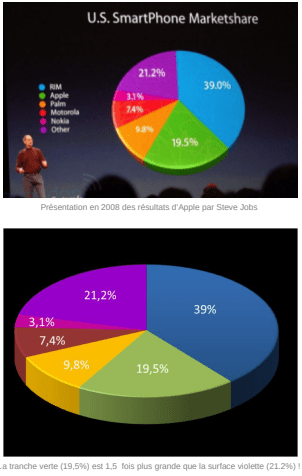

You should avoid using three-dimensional charts in data visualization because they can be misleading and fail to reflect reality. A famous example illustrates this issue during a 2008 Steve Jobs presentation, where he used a 3D pie chart. This choice made the 19.5% share appear larger than the 21.2% share when he was presenting smartphone market share data.
Nevertheless, pie charts can sometimes be relevant, especially when the data does not present the issues described above. Here are some examples of ineffective pie charts:
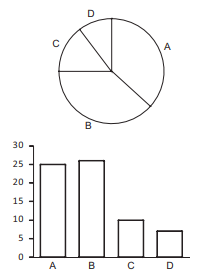
This pie chart shows that slices A and B look similar at first glance, but the bar chart representation proves otherwise.
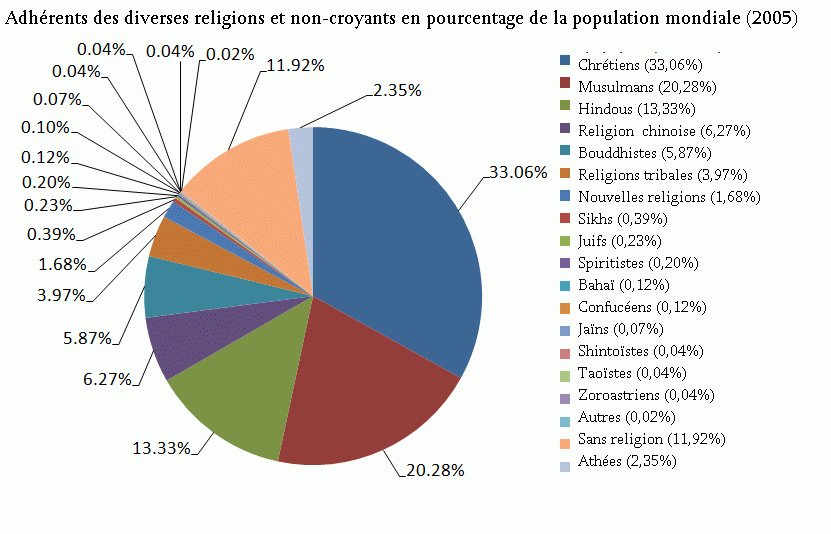
In this example, we can observe two phenomena. First, the chart becomes unreadable due to the large number of categories. Second, some categories have very small values, making them invisible.
It is crucial to take your time when creating a data visualization. This process allows you to refine details, choose appropriate colors, and structure information logically to ensure the message is conveyed in a clear and impactful way. Investing time in the design of the visualization results in better understanding and greater efficiency in communicating information.
The field of data visualization is constantly expanding and seeing a proliferation of visualizations, as well as the emergence of new professions such as data journalists, data designers, and data artists.
Data visualization is an art, but it is also a science. Visualization designers must be aware of the impact their choices have on the understanding and interpretation of data. In particular, they must be careful to question the impact, accuracy, and harmony of their creation. It should also be noted that a single interesting and actionable perspective will be more relevant than 1,000 detailed analyses.
As a viewer, it is essential to remember that data are merely tools for telling a story, and the way they are presented can have a significant impact on the perception of that story. Ask yourself questions about the relevance of the charts, the choices of colors, scales used, and ensure that the visualization faithfully reflects the underlying data.
Data visualization is a powerful tool for communicating complex information, but it must be used with responsibility. It can illuminate the world, but it can also distort it. By understanding its potential and its pitfalls, we can navigate the data age with confidence and clarity.
Lorem ipsum dolor sit amet consectetur. Ipsum penatibus viverra feugiat amet varius pharetra porta risus lectus. Turpis enim massa non tincidunt in faucibus.